Running a studio without data?
Most studio owners make critical business decisions based on gut feeling. Without clear numbers, you're leaving money on the table and missing opportunities to grow.
Flying blind without data
You have no clear picture of how your studio is really performing. Revenue feels okay, but you can't pinpoint what's working and what's not.
Decisions based on gut feeling, not factsManual revenue tracking
Tallying up earnings at the end of the month with a calculator or notebook. It takes hours and the numbers never quite add up.
Hours wasted on manual bookkeepingGuessing your busy hours
You think you know when your studio is busiest, but without data you're staffing based on assumptions. Quiet days are overstaffed, busy days are chaotic.
Inefficient scheduling and lost revenueNo employee performance visibility
Which team member brings in the most revenue? Who has the best booking rate? Without these answers, fair compensation and growth plans are impossible.
Can't reward top performers fairlyScattered data across tools
Some numbers are in your calendar, others in a notebook, payment data lives in the POS terminal. Pulling it all together for a complete picture is a nightmare.
No single source of truth for your businessCannot spot trends early
By the time you notice revenue dropping or a service losing popularity, it's already too late to react. Trends that could save your business go unnoticed.
Missed opportunities to pivot and adapt
Your studio's command center
inkStar's Report Dashboard turns your raw business data into clear, actionable insights. See exactly what's happening in your studio at a glance.
Data flows in automatically
Every appointment, payment, and service is tracked in real time - no manual entry needed.
Spot patterns instantly
Interactive charts reveal trends in revenue, bookings, and team performance at a glance.
Make smarter decisions
Use real data to optimize pricing, staffing, and services for maximum growth.
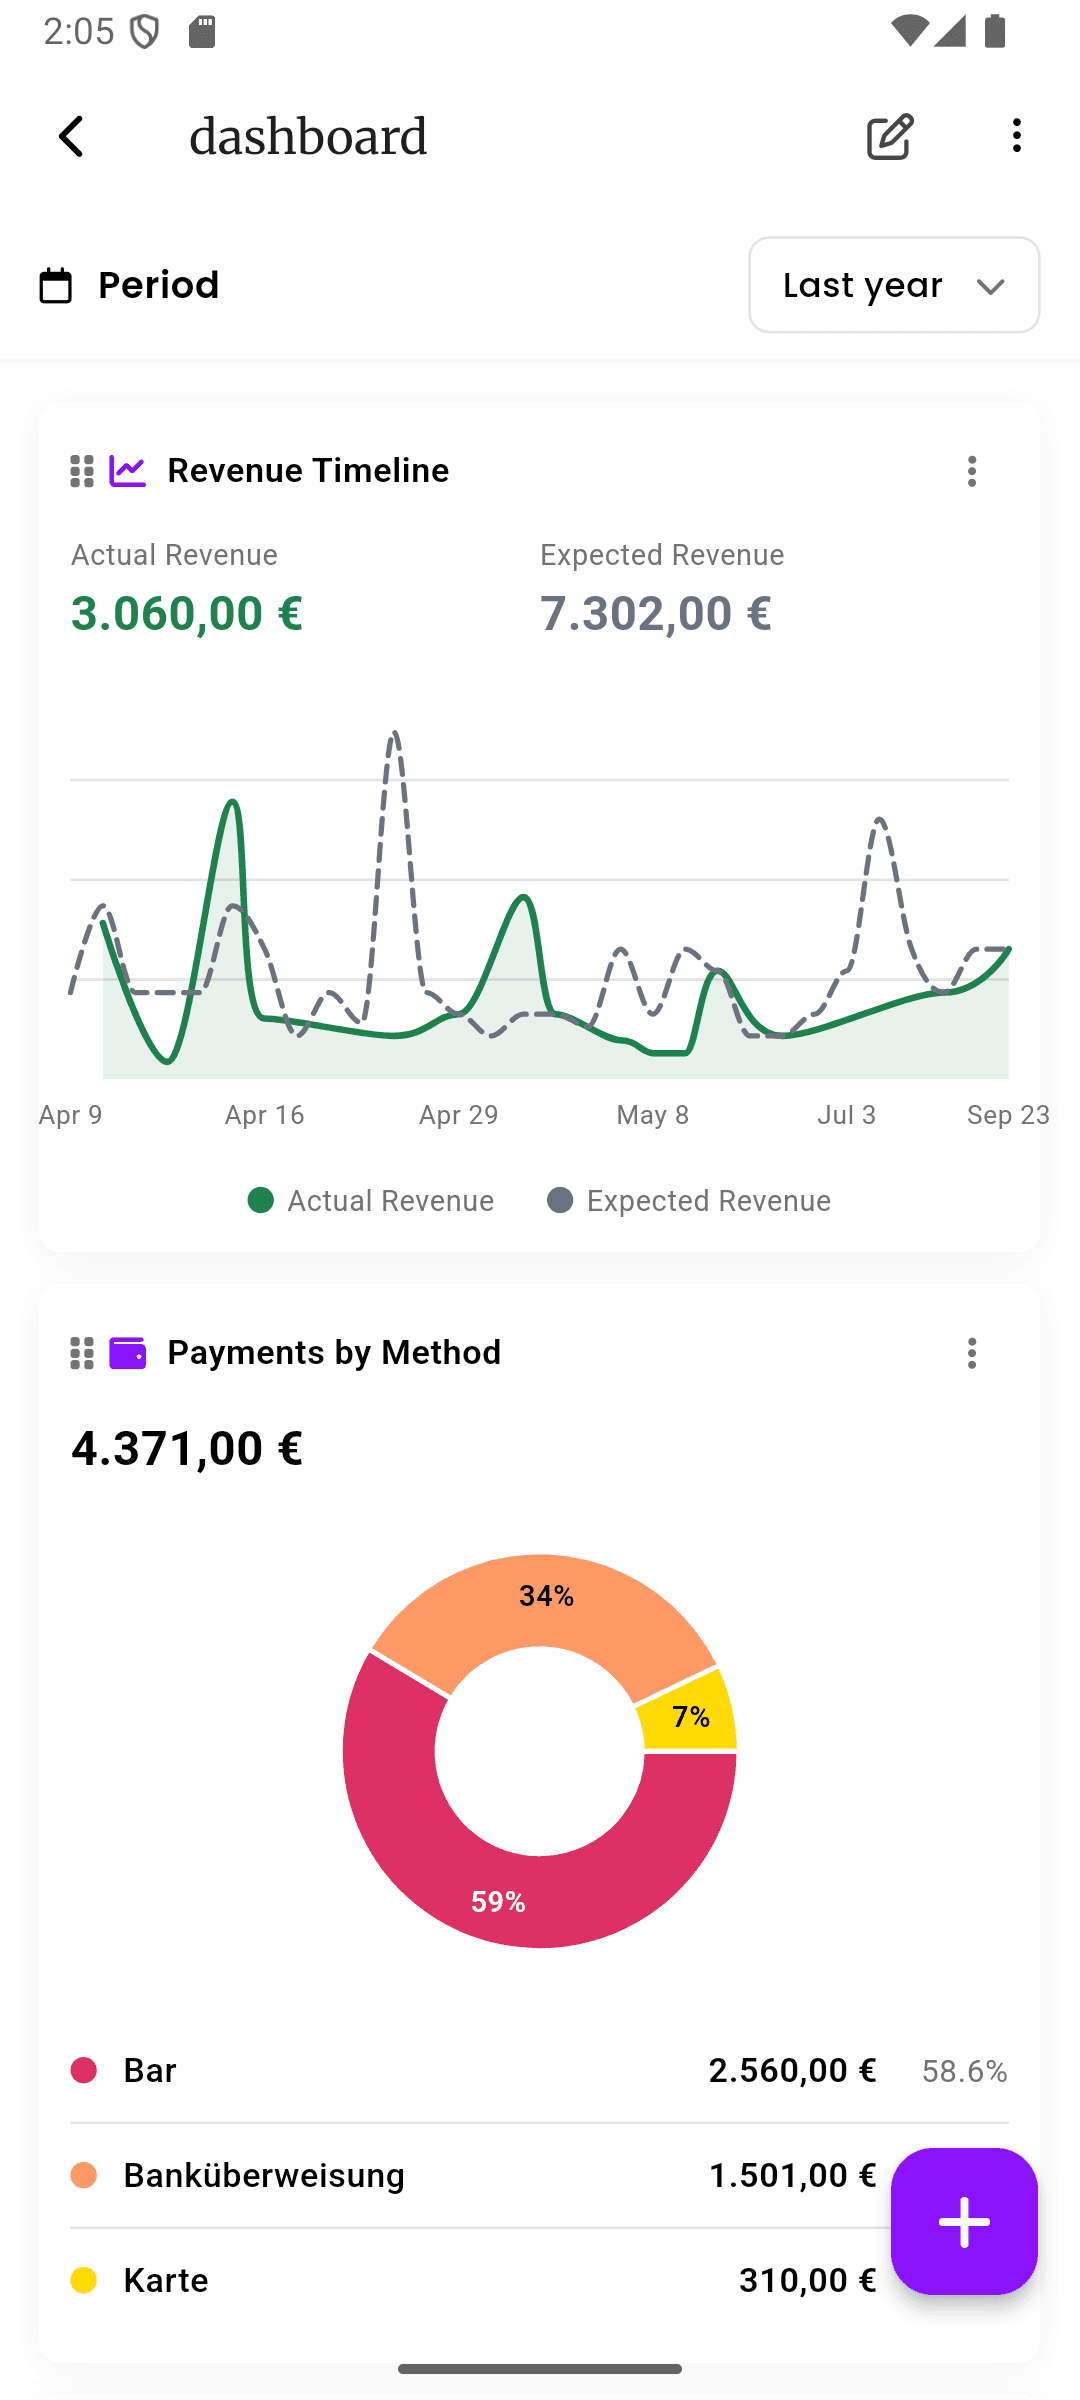
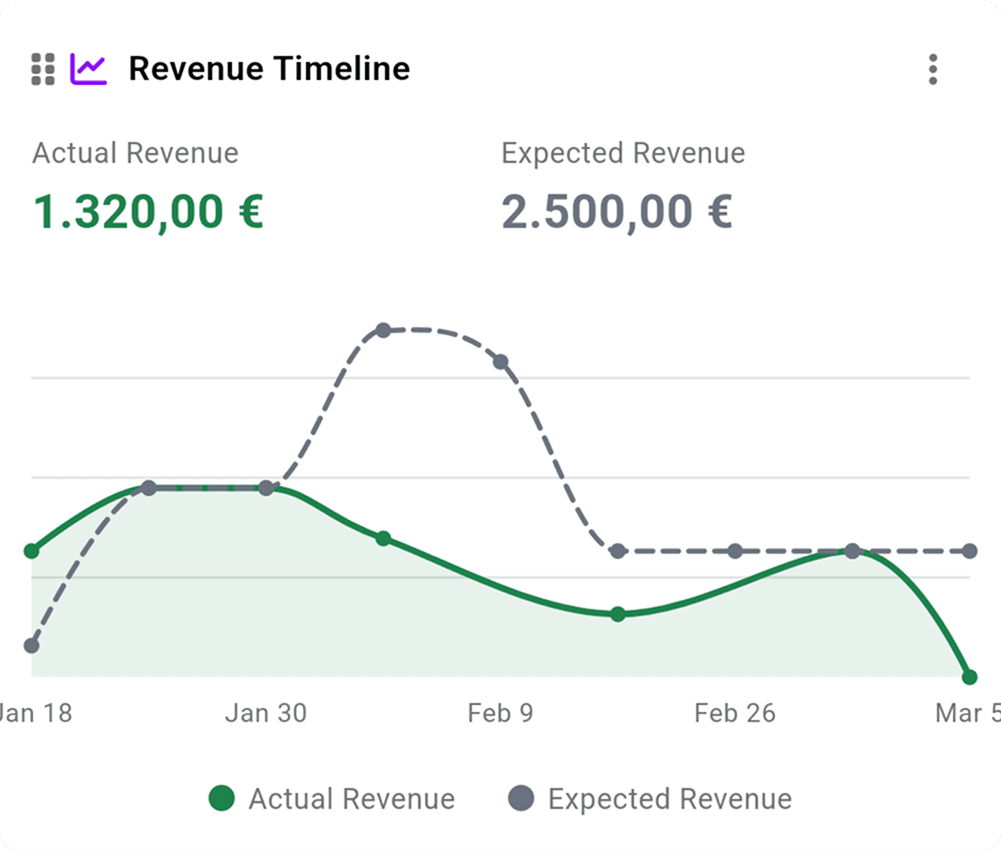
Revenue dashboard
Track total revenue over time with interactive timeline charts and date range filters.
Revenue by service
See which services generate the most income and identify your most profitable offerings.
Service breakdown
Understand the mix of services your studio provides and how demand shifts over time.
Payment tracking
Monitor payment methods used by clients - cash, card, transfer - to optimize your checkout flow.
Employee performance
Compare revenue and bookings per team member to identify top performers and coaching opportunities.
Appointment analytics
See booking patterns by day and hour to understand when your studio is busiest.
Visual charts
Beautiful, interactive charts that make complex data easy to understand at a glance.
Export reports
Download your data for tax preparation, team meetings, or deeper analysis in your own tools.
Every chart tells a story
Dive deep into the analytics that matter most for your studio. Each report is designed to answer the questions studio owners actually ask.
Revenue Timeline
Watch your revenue evolve over days, weeks, or months. The timeline chart shows your earnings trajectory so you can spot growth, dips, and seasonal patterns before they become problems.
- Filter by any date range to compare periods
- See daily, weekly, or monthly revenue trends
- Instantly spot revenue dips and growth spikes
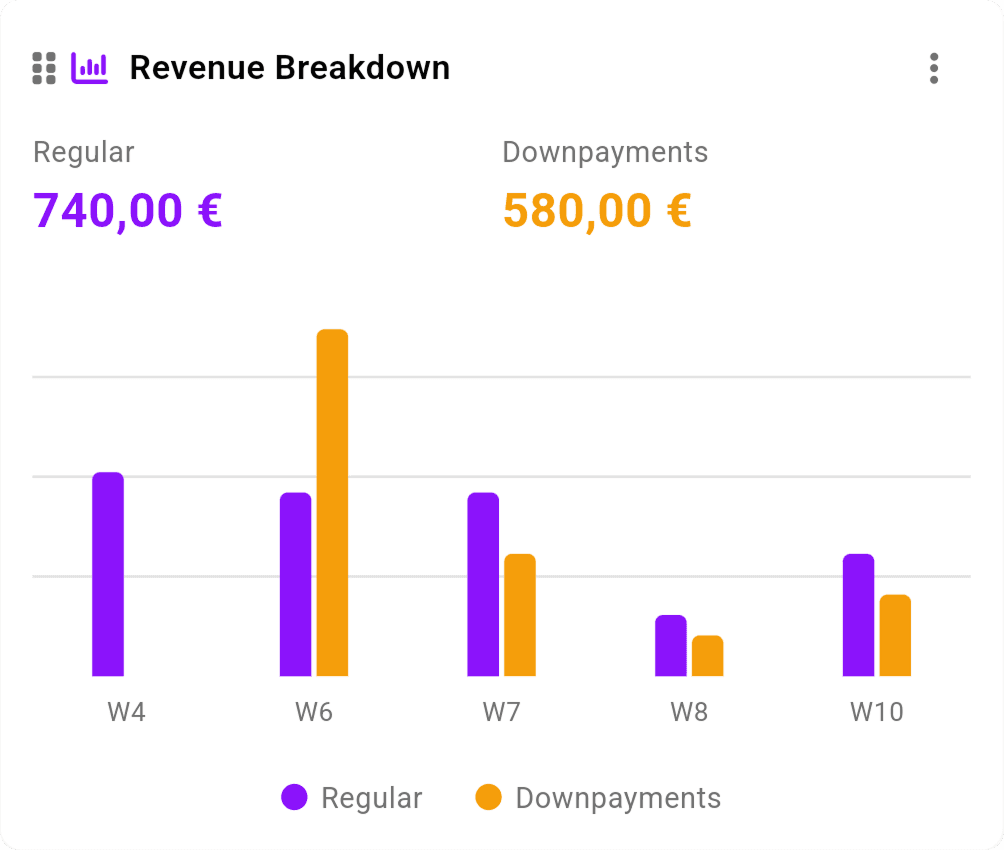
Revenue Breakdown
Know exactly where your money comes from. The breakdown chart splits your revenue by service type, so you can double down on what's profitable and reconsider what's not.
- See which services bring in the most revenue
- Compare revenue share across your service menu
- Identify underperforming services to optimize or retire
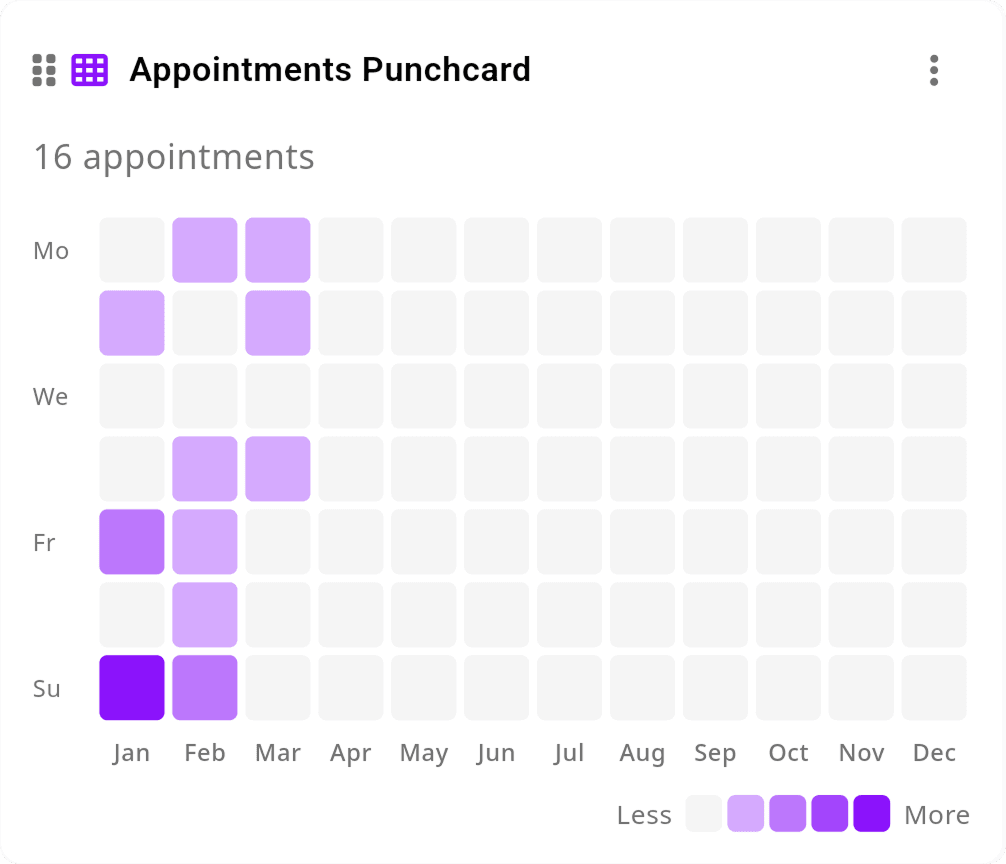
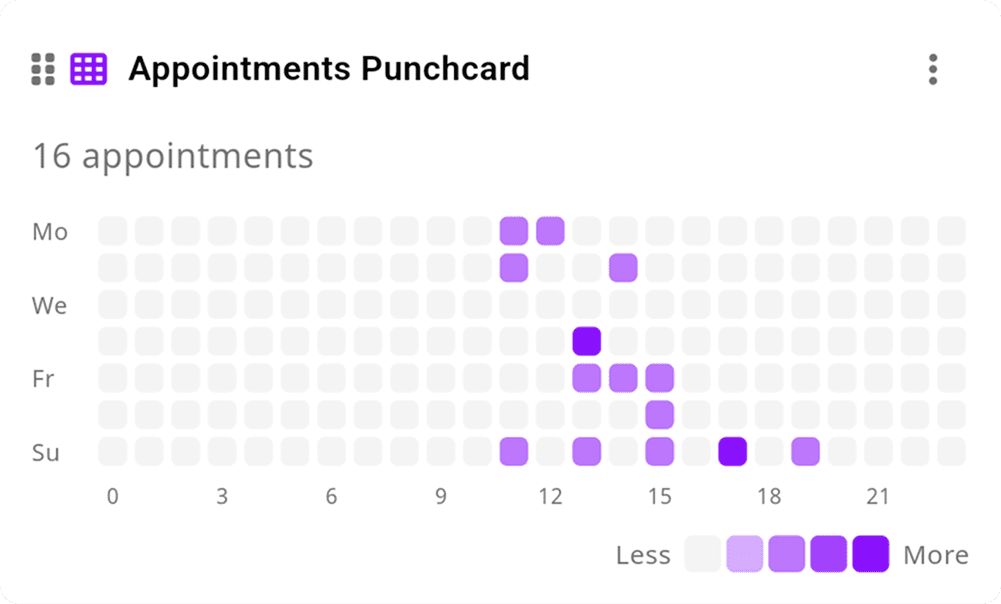
Appointment Punchcard
A heatmap of your bookings across every hour and day of the week. The punchcard reveals your studio's natural rhythm - when clients book most and when your chairs sit empty.
- Visualize booking density by day and hour
- Identify peak hours and quiet periods at a glance
- Plan staffing and promotions around real demand
Busy Hours Analysis
See your busiest hours ranked in a clear bar chart. No more guessing when you need extra hands on deck - the data tells you exactly when your studio is at full capacity.
- Ranked view of your most popular time slots
- Optimize opening hours based on actual demand
- Reduce gaps by offering deals during quiet hours
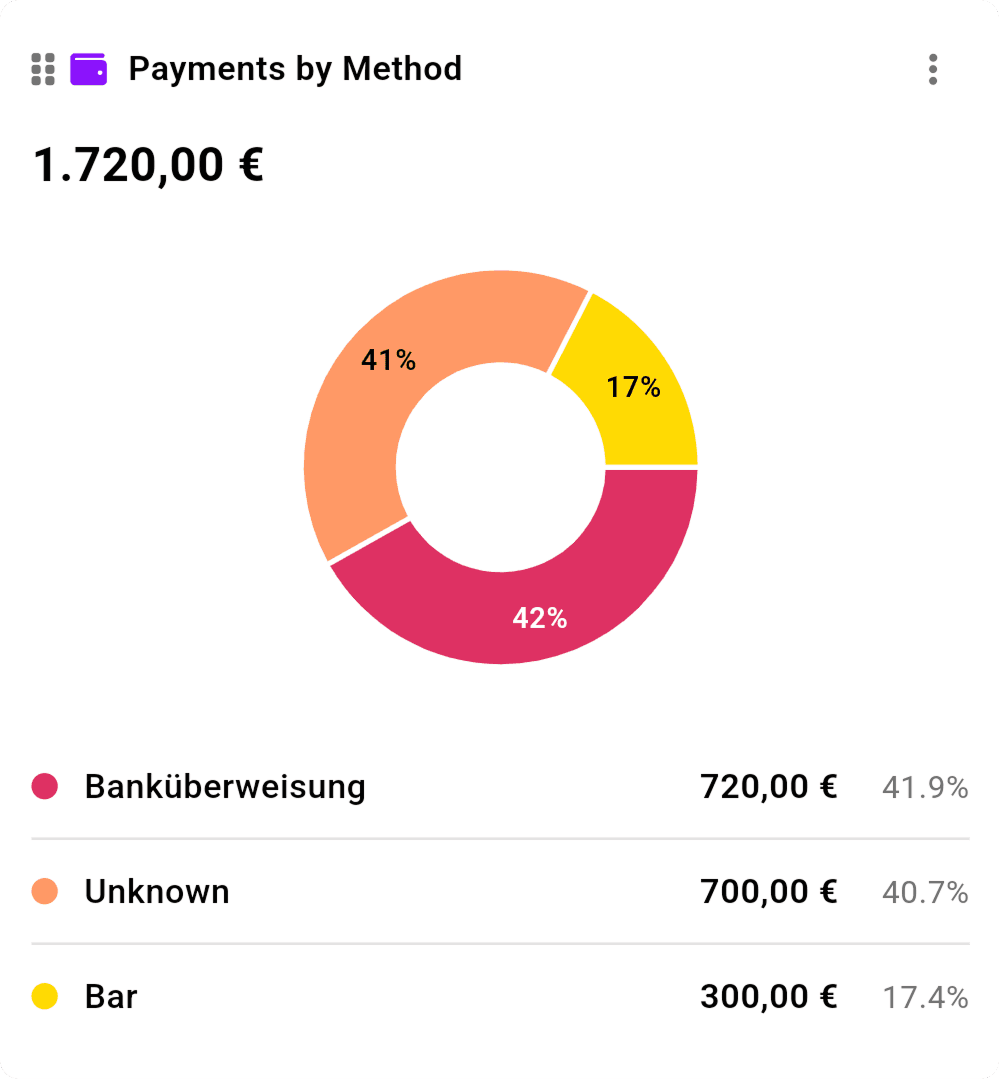
Payment Methods
Track how your clients prefer to pay. Whether it's cash, card, or bank transfer, understanding payment preferences helps you streamline checkout and plan your cash flow.
- See the split between cash, card, and transfer payments
- Track payment preferences over time
- Make informed decisions about payment terminal investments
Why studios choose inkStar
See how inkStar's built-in analytics compare to the tools you're using today.
| Feature | Pen & Paper Notebook + receipts | Spreadsheets Excel, Google Sheets | inkStar Built for studios |
|---|---|---|---|
| Revenue tracking | Manual tallying | Manual entry | Automatic, real-time |
| Visual charts | Not possible | Build your own | Beautiful, built-in |
| Appointment analytics | Not possible | No booking data | Punchcard + heatmaps |
| Revenue by service | Guesswork | Manual categories | Auto-categorized |
| Employee performance | Not tracked | Very tedious | Per-employee dashboards |
| Peak hours analysis | Gut feeling | Pivot tables needed | Visual heatmaps |
| Payment method tracking | Not tracked | Manual logging | Automatic breakdown |
| Date range filtering | Flip through pages | Filter formulas | One-tap date picker |
| Real-time updates | End-of-day only | After manual entry | Live, always current |
| Mobile access | Carry the notebook | Clunky on mobile | Native mobile app |
Revenue tracking
- Pen & Paper
- Manual tallying
- Spreadsheets
- Manual entry
- inkStar
- Automatic, real-time
Visual charts
- Pen & Paper
- Not possible
- Spreadsheets
- Build your own
- inkStar
- Beautiful, built-in
Appointment analytics
- Pen & Paper
- Not possible
- Spreadsheets
- No booking data
- inkStar
- Punchcard + heatmaps
Revenue by service
- Pen & Paper
- Guesswork
- Spreadsheets
- Manual categories
- inkStar
- Auto-categorized
Employee performance
- Pen & Paper
- Not tracked
- Spreadsheets
- Very tedious
- inkStar
- Per-employee dashboards
Peak hours analysis
- Pen & Paper
- Gut feeling
- Spreadsheets
- Pivot tables needed
- inkStar
- Visual heatmaps
Payment method tracking
- Pen & Paper
- Not tracked
- Spreadsheets
- Manual logging
- inkStar
- Automatic breakdown
Date range filtering
- Pen & Paper
- Flip through pages
- Spreadsheets
- Filter formulas
- inkStar
- One-tap date picker
Real-time updates
- Pen & Paper
- End-of-day only
- Spreadsheets
- After manual entry
- inkStar
- Live, always current
Mobile access
- Pen & Paper
- Carry the notebook
- Spreadsheets
- Clunky on mobile
- inkStar
- Native mobile app
Studio owners love their insights
See how studios are using inkStar's Report Dashboard to make smarter business decisions every day.
“Finally, I can see exactly where my revenue comes from.”
Before inkStar, I had no idea which services were actually profitable. The revenue breakdown showed me that my most popular service had the thinnest margins. I restructured my pricing and saw a real improvement within a month.
Marco T.Tattoo Studio Owner · Berlin, Germany“The punchcard changed how I schedule my week.”
I always thought Mondays were slow, but the appointment heatmap showed me that my Tuesday mornings were the real dead zone. I moved my day off from Monday to Tuesday morning and filled those Monday slots with bookings.
Elena R.PMU Artist · Vienna, Austria“Now I know exactly when to bring in extra staff.”
The busy hours chart made it obvious that Friday afternoons and Saturday mornings were when we needed all hands on deck. I adjusted our staffing schedule and the difference in client wait times was immediate.
David K.Barber Shop Owner · Munich, Germany
Frequently asked questions
Everything you need to know about inkStar's Report Dashboard and business analytics.
inkStar offers revenue timeline charts, revenue breakdown by service, appointment punchcard heatmaps, busy hours analysis, payment method distribution, and employee performance comparisons. All reports update in real time as new data flows in.
You can view reports for any date range since you started using inkStar. Use the built-in date picker to select custom ranges - compare this month to last month, this quarter to the same quarter last year, or any period you choose.
Yes. The Report Dashboard lets you filter analytics by team member, so you can compare revenue, appointment counts, and service mix for each employee individually. This is perfect for performance reviews and fair commission structures.
No. All analytics are generated automatically from your appointments, payments, and services managed in inkStar. There is no manual data entry required - just use inkStar as you normally would, and the insights appear on their own.
Yes. You can export your report data for use in tax preparation, team meetings, or further analysis in external tools. This makes it easy to share insights with your accountant or business partners.
Reports update in real time. As soon as an appointment is completed or a payment is recorded, the numbers in your dashboard reflect the change. You always see the most current state of your business.
Absolutely. The revenue breakdown chart shows exactly how much income each service generates. You can see the proportion of revenue from tattoos, piercings, PMU treatments, barbering, or whatever services your studio offers.
Yes. The Report Dashboard is fully accessible from the inkStar mobile app. Check your numbers on the go, whether you are between appointments or away from the studio.
Still have questions? Chat with our team